Image Details
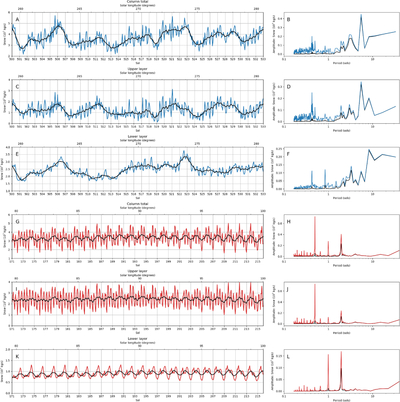
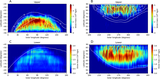
Caption: Figure 8.
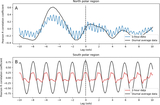
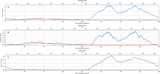
(Left column): the same as Figure 2, except showing at temporal higher resolution only the period of 20° of LS centered on the winter solstice for the northern hemisphere (A), (C), (E) and the southern hemisphere (G), (I), (K). Snow generation amounts are shown for the total atmospheric column (A), (G), the upper layer (C), (I), and the lower layer (E), (K). (Right column): Fourier amplitude spectra of the time series in the left column.
Other Images in This Article
Copyright and Terms & Conditions
© 2026. The Author(s). Published by the American Astronomical Society.
Copyright ©
2026 Astronomy Image Explorer. All Rights Reserved.