Image Details
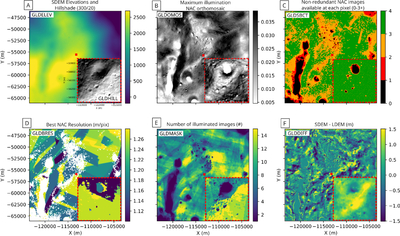
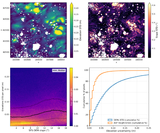
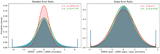
Caption: Figure 18.
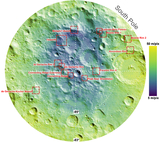
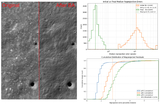
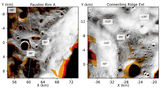
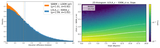
Example at de Gerlache–Kocher Massif (minx = −123.4, miny = −66.1, maxx = −103.4, maxy = −46.1 km from the lunar south pole) of geospatial products archived on S. Bertone et al. (2025) for each of the 13 regions. The central portion shows a 500 m × 500 m zoom around the centroid of the region for each product (marked by a red dot, minx = −113.65, miny = −56.35, maxx = −113.15, maxy = −55.85 km from the lunar south pole). Standard product names from Table 1 are listed on the top left of each frame.
Other Images in This Article
Show More
Copyright and Terms & Conditions
© 2026. The Author(s). Published by the American Astronomical Society.
Copyright ©
2026 Astronomy Image Explorer. All Rights Reserved.