Image Details
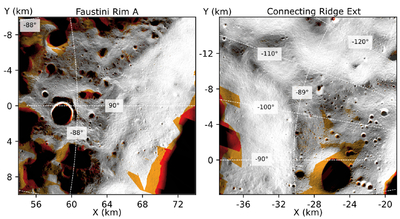
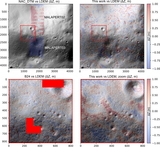
Caption: Figure 6.
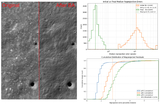
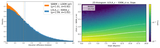
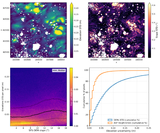
Maximum-illumination plots for the Faustini Rim A and the Connecting Ridge Extension regions, shown in south polar stereographic projection with geodetic coordinates overlaid. Pixels are color-coded based on the number of available NAC images with nonredundant solar azimuthal angles (≥30° apart): black for 0 images (mostly PSRs); red and orange for 1 and 2 nonredundant images, respectively (not optimal for SfS); and gray for optimally illuminated pixels (≥3 nonredundant images). NAC coverage across these regions is generally well suited to support SfS (outside of PSRs and adjacent areas). We provide similar plots for all regions in the supplementary material (S. Bertone et al. 2025), and region-wise statistics are shown in Figure 3.
Other Images in This Article
Show More
Copyright and Terms & Conditions
© 2026. The Author(s). Published by the American Astronomical Society.