Image Details
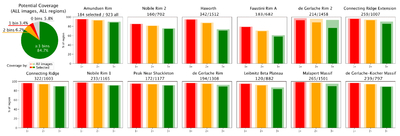
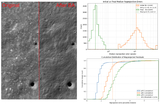
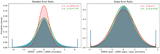
Caption: Figure 3.
Region-wise statistics of pixels illuminated in at least 1 (red), 2 (yellow), or 3 (green) images with different illumination angles (see the geographic distribution for specific regions in Figure 6). The difference between 100% of the region and the colored bars indicates the fraction of pixels not imaged by LROC NAC (e.g., within PSRs). For each region, we indicate its name and both the number of images used for SfS (“selected”) and for bundle adjustment (“all”). The difference between the light and dark bars represents the coverage “lost” due to this selection, which reduces the number of images (and thus the computational burden) while preserving as much information as possible for SfS processing.
Other Images in This Article
Show More
Copyright and Terms & Conditions
© 2026. The Author(s). Published by the American Astronomical Society.