Image Details
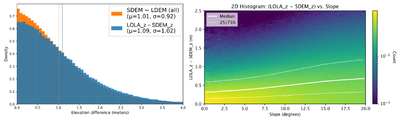
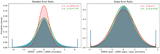
Caption: Figure 7.
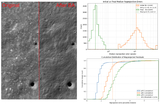
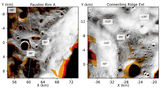
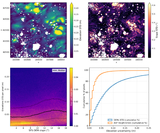
Left: elevation differences between our SDEMs and either the LOLA point cloud (LOLA_z) or the LDEM for all 13 regions combined. Right: differences between LOLA points and SDEM elevation values across all regions tend to increase with terrain slopes (as shown by the median and interquartile trends traced in white), while mostly showing deviations <1 m from the reference LOLA network.
Other Images in This Article
Show More
Copyright and Terms & Conditions
© 2026. The Author(s). Published by the American Astronomical Society.
Copyright ©
2026 Astronomy Image Explorer. All Rights Reserved.