Image Details
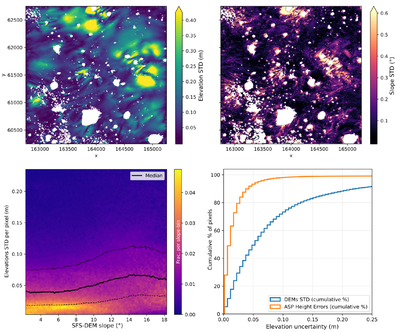
Caption: Figure 8.
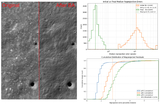
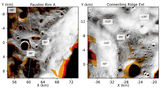
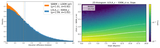
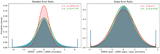
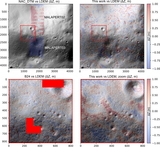
Standard deviation of elevation (top left) and slope (top right) for a small ensemble of SfS solutions computed by applying SfS to different sets of LROC NAC images covering a crop of the central region of Amundsen Rim. The lower row shows the statistical behavior of such uncertainties across similar crops in all regions. The bottom-left panel shows two different “regimes” for low- and high-slope pixels, as expected from SfS defects being amplified in steep terrain. The bottom-right panel shows that ASP-computed “height errors” significantly underestimate image-sampling errors from our elevation uncertainty maps.
Other Images in This Article
Show More
Copyright and Terms & Conditions
© 2026. The Author(s). Published by the American Astronomical Society.