Image Details
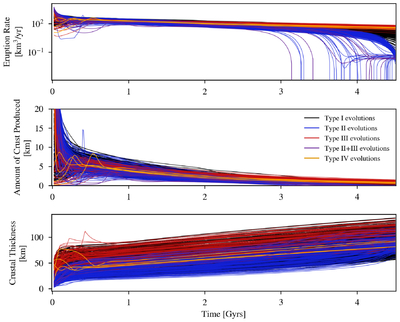
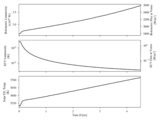
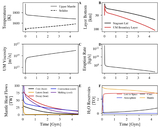
Caption: Figure 25.
The evolution of the eruption rate, the amount of crust produced at each output time (10 Myr) and the crustal thickness, color-coded by the different types of evolutionary scenarios described in the text. In plotting the time evolution of these variables, we have removed the first 20 Myr of evolution, which are highly subject to transient effects. Note that the crustal thickness is not equivalent to the integrated amount of crust produced at each output time because the crustal thickness is limited by the stagnant lid thickness. Note that there are no massive eruptions (which could represent catastrophic resurfacing events) in the recent 1.5 Gyr of any of our simulations.
Other Images in This Article
Show More
Copyright and Terms & Conditions
© 2026. The Author(s). Published by the American Astronomical Society.