Image Details
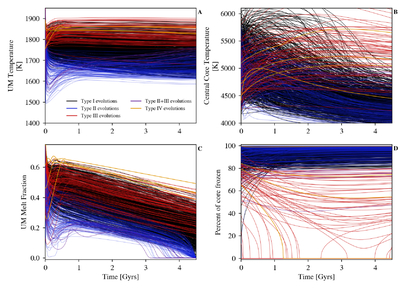
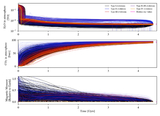
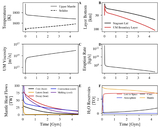
Caption: Figure 6.
The evolution of a few key mantle and core variables for all of our simulations, color-coded by the different evolutionary types. The top-left and top-right panels show the evolution of the upper mantle (UM) temperature and core temperature, respectively. Notice that in Type II evolutions, the mantle temperature tends to increase more rapidly than the other types, while Type III evolutions tend to maintain a higher mantle and core temperature than the other types. The bottom-left panel shows the upper mantle melt fraction over time, which highlights the characteristic behavior of the Type II evolutions: ending with a low melt fraction. The bottom-right panel shows the fraction of the core that is solid over time. Note that Type III and Type IV evolutions both end with an inner-core radius fraction less than (and for most simulations, much less than) 0.8. No simulation results in a completely solid core. The Type II+III behavior can be seen across the panels, where they behave more like Type II evolutions for mantle-relevant outputs (like the mantle temperature), but behave more like Type III evolutions for core-relevant outputs (as can be seen in the evolution of the inner core over time).
Other Images in This Article
Show More
Copyright and Terms & Conditions
© 2026. The Author(s). Published by the American Astronomical Society.