Image Details
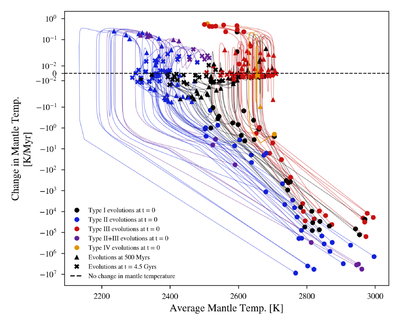
Caption: Figure 7.
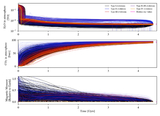
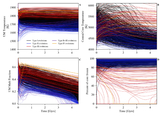
The evolution of a random subset of 30 simulations for each evolutionary type in the mantle phase space. Note that the y-axis is plotted as a symmetric logarithm: the values are plotted on a logarithmic scale except in the range −10−2 to 10−2, which is plotted on a linear scale, allowing for the plotting of positive and negative values on a logarithmic scale. The filled circles represent the initial state of each simulation, the triangles represent the value after 500 Myr, and the filled x represents the final state of each simulation; color encodes the evolutionary type. Most of the plotted simulations cool quickly and then stabilize, except for Type II evolutions, which heat up due to dehydration stiffening, which slows convection. Note that while some simulations start by heating up, no Type II evolution does.
Other Images in This Article
Show More
Copyright and Terms & Conditions
© 2026. The Author(s). Published by the American Astronomical Society.