Image Details
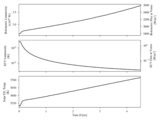
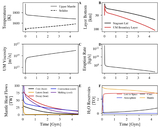
Caption: Figure 5.
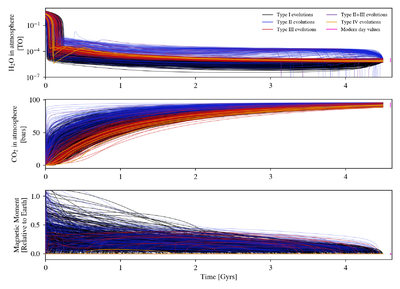
The evolution of all of our simulations that matched modern-day Venus constraints (shown offset from 4.5 Gyr in pink). Our simulations are color-coded by the different types of evolutionary scenarios described in the text. In the top panel, we show that each evolution converges to the 2.868 ± 0.2868 mbar of H2O in Venus’ atmosphere (G. Arney et al. 2014). While Type I and Type III evolutions reach that value similarly, Type II evolutions tend to either outgas more water over time, leading to higher amounts in the atmosphere, or cease melting for a time, leading to epochs with no water in the atmosphere. Note that Type II+III evolutions exhibit outgassing rates more in line with Type II than Type III evolutions. The oscillations characteristic of the Type IV evolutions can best be seen in this panel. Note that in the top panel, for every case in which the atmospheric water drops below 10−7 TO, later epochs of outgassing replenish atmospheric water to the observed value. The middle panel shows the evolutions converging to the 92.254 ± 0.765 bar of CO2 in Venus’ atmosphere (D. C. Catling & J. F. Kasting 2017). Again, we can see that Type II evolutions have higher outgassing rates and thus outgas CO2 more quickly than the other evolutions. In the bottom panel, we show how each evolution leads to a magnetic moment of ﹩\lt 1{0}^{-5}{{ \mathcal M }}_{\oplus }﹩ (J. L. Phillips & C. T. Russell 1987). Note that many cases have transient magnetic fields.
Other Images in This Article
Show More
Copyright and Terms & Conditions
© 2026. The Author(s). Published by the American Astronomical Society.