Image Details
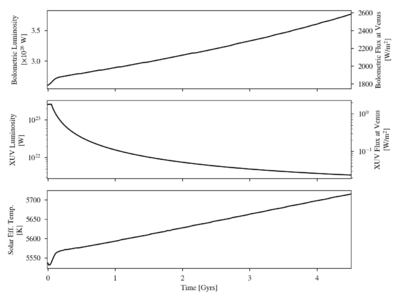
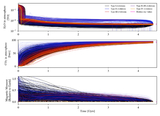
Caption: Figure 4.
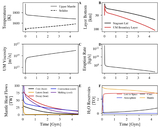
The top panel shows the evolution of the Sun’s bolometric luminosity over time both in Watts and in terms of the incident flux at Venus. The middle panel shows the evolution of the Sun’s XUV luminosity over time again in Watts and in terms of the incident flux at Venus. Luminosity over time is calculated based on the interpolated I. Baraffe et al. (2015) model. The evolution of the effective temperature of the Sun is shown in the bottom panel.
Other Images in This Article
Show More
Copyright and Terms & Conditions
© 2026. The Author(s). Published by the American Astronomical Society.
Copyright ©
2026 Astronomy Image Explorer. All Rights Reserved.