Image Details
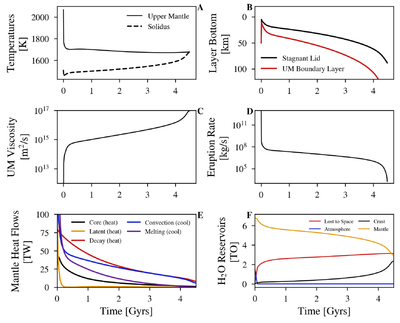
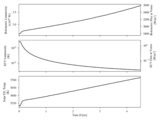
Caption: Figure 11.
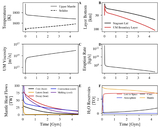
Time evolution of select key mantle variables for a sample evolution with Type II behavior. Panel (A) plots the upper mantle and solidus temperatures over time; panel (B) shows the depth to the bottom of the stagnant lid layer and the upper mantle thermal boundary layer; panel (C) shows the upper mantle viscosity; panel (D) shows the eruption rate; panel (E) shows the different heat sources and sinks (cooling mechanisms) for the mantle, and panel (F) shows the evolution of the water reservoirs in the simulation. Note that the Type II behavior can be seen as the upper mantle viscosity rises toward the end of the simulation, causing the melt zone (beneath the thermal boundary layer and stagnant lid) to be pushed deeper to higher pressures, causing the solidus temperature to sharply rise. This causes the eruption rate and thus the steady-state amount of water in the atmosphere to drop as well. Note that the mantle has two periods of drastic water loss: the first at the beginning to replenish water lost to space from the atmosphere, and the second driven by the increase in viscosity. Parameter choices for this evolution can be found in Table 7.
Other Images in This Article
Show More
Copyright and Terms & Conditions
© 2026. The Author(s). Published by the American Astronomical Society.