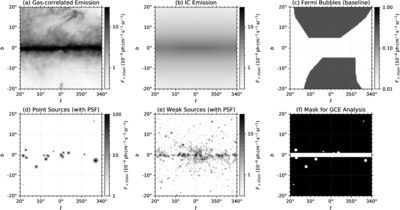
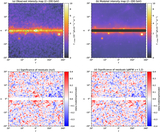
Image Details

Choose export citation format:

Observations of the Fermi Bubbles and the Galactic Center Excess with the Dark Matter Particle Explorer

  • Authors: F. Alemanno, Q. An, P. Azzarello, F. C. T. Barbato, P. Bernardini, X. J. Bi, H. V. Boutin, I. Cagnoli, M. S. Cai, E. Casilli, J. Chang, D. Y. Chen, J. L. Chen, Z. F. Chen, Z. X. Chen, P. Coppin, M. Y. Cui, T. S. Cui, I. De Mitri, F. de Palma, A. Di Giovanni, T. K. Dong, Z. X. Dong, G. Donvito, J. L. Duan, K. K. Duan, R. R. Fan, Y. Z. Fan, F. Fang, K. Fang, C. Q. Feng, L. Feng, S. Fogliacco, J. M. Frieden, P. Fusco, M. Gao, F. Gargano, E. Ghose, K. Gong, Y. Z. Gong, D. Y. Guo, J. H. Guo, S. X. Han, Y. M. Hu, G. S. Huang, X. Y. Huang, Y. Y. Huang, M. Ionica, L. Y. Jiang, W. Jiang, Y. Z. Jiang, J. Kong, A. Kotenko, D. Kyratzis, S. J. Lei, B. Li, M. B. Li, W. H. Li, W. L. Li, X. Li, X. Q. Li, Y. M. Liang, C. M. Liu, H. Liu, J. Liu, S. B. Liu, Y. Liu, F. Loparco, M. Ma, P. X. Ma, T. Ma, X. Y. Ma, G. Marsella, M. N. Mazziotta, D. Mo, Y. Nie, X. Y. Niu, A. Parenti, W. X. Peng, X. Y. Peng, C. Perrina, E. Putti- Garcia, R. Qiao, J. N. Rao, Y. Rong, R. Sarkar, P. Savina, A. Serpolla, Z. Shangguan, W. H. Shen, Z. Q. Shen, Z. T. Shen, L. Silveri, J. X. Song, H. Su, M. Su, H. R. Sun, Z. Y. Sun, A. Surdo, X. J. Teng, A. Tykhonov, G. F. Wang, J. Z. Wang, L. G. Wang, S. Wang, X. L. Wang, Y. F. Wang, D. M. Wei, J. J. Wei, Y. F. Wei, D. Wu, J. Wu, S. S. Wu, X. Wu, Z. Q. Xia, Z. Xiong, E. H. Xu, H. T. Xu, J. Xu, Z. H. Xu, Z. L. Xu, Z. Z. Xu, G. F. Xue, M. Y. Yan, H. B. Yang, P. Yang, Y. Q. Yang, H. J. Yao, Y. H. Yu, Q. Yuan, C. Yue, J. J. Zang, S. X. Zhang, W. Z. Zhang, Yan Zhang, Yi Zhang, Y. J. Zhang, Y. L. Zhang, Y. P. Zhang, Y. Q. Zhang, Z. Zhang, Z. Y. Zhang, C. Zhao, H. Y. Zhao, X. F. Zhao, C. Y. Zhou, X. Zhu, Y. Zhu

F. Alemanno et al 2026 The Astrophysical Journal Supplement Series 284 .

  • Provider: AAS Journals

Caption: Figure 16.

(a)–(e) Maps of the components and (f) mask in the analyses of the GC excess. The first four components are the same as those in the analyses of the bubbles. The color bars are adjusted for better visualization. The fifth map is for the weak sources detected by Fermi but not by DAMPE.

Other Images in This Article

Show More

Copyright and Terms & Conditions

Additional terms of reuse