

Image Details
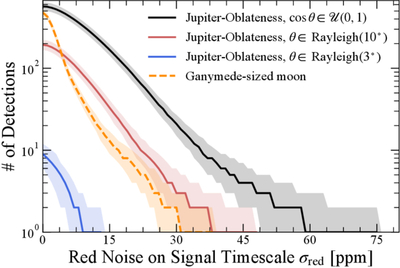
Caption: Figure 8.
Sensitivity of the predicted yields to an added red-noise floor on the relevant signal timescale. The horizontal axis specifies σred, the additional noise added in quadrature to the ETC white-noise prediction after averaging to the relevant timescale (half the transit duration for moon detection, and half the ingress/egress duration for oblateness detection). Solid curves show the number of systems with detectable Jupiter-like oblateness for the three assumed obliquity distributions. The dashed orange curve shows the number of systems for which a Ganymede-sized moon would be detectable. Shaded regions show the 16th–84th percentile range over Monte Carlo realizations. In all cases, the host star sample was the combined 0.1–1.6 M⊙ sample.
Other Images in This Article
Show More
Copyright and Terms & Conditions
© 2026. The Author(s). Published by the American Astronomical Society.

