

Image Details
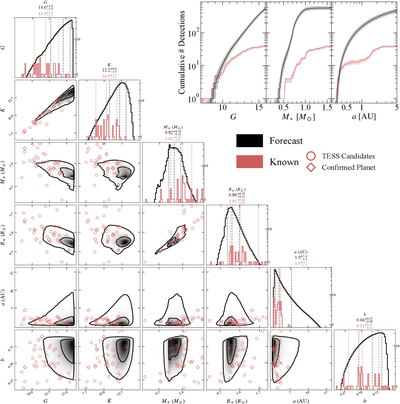
Caption: Figure 10.
Corner plot comparing the forecasted oblateness-favorable population (black) with the currently known confirmed and candidate systems (red). The upper-right panel shows cumulative distributions of G, M⋆, and a. The observed sample is fairly complete at the brightest magnitudes and smallest separations, but shows a growing deficit toward optically fainter stars, lower-mass stars, and larger orbital separations.
Other Images in This Article
Show More
Copyright and Terms & Conditions
© 2026. The Author(s). Published by the American Astronomical Society.

Copyright ©
2026 Astronomy Image Explorer. All Rights Reserved.
