

Image Details
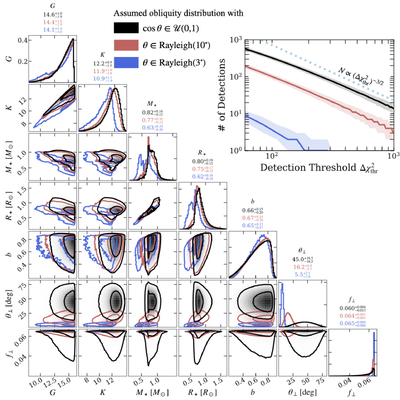
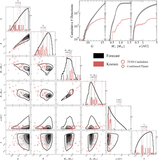
Caption: Figure 7.
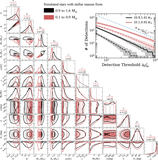
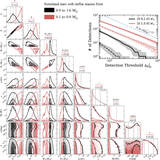
Parameter distributions of simulated systems for which Jupiter-like oblateness is detectable with Δχ2 > 60, shown for three true obliquity distributions: isotropic (black), Rayleigh peaking at 10∘ (red), and Rayleigh peaking at 3∘ (blue). Above each histogram are median values and 16th/84th percentiles. The upper-right panel shows how the number of detections scales with the Δχ2 threshold for the ETC noise model; shaded bands indicate the 1σ range, and the dotted line shows the reference scaling ﹩N\propto {({\rm{\Delta }}{\chi }_{{\rm{thr}}}^{2})}^{-3/2}﹩.
Other Images in This Article
Show More
Copyright and Terms & Conditions
© 2026. The Author(s). Published by the American Astronomical Society.

Copyright ©
2026 Astronomy Image Explorer. All Rights Reserved.
