

Image Details
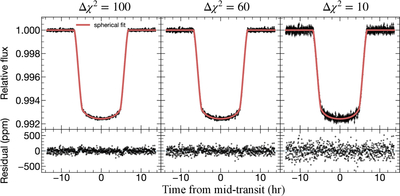
Caption: Figure 4.
Simulated light curves illustrating different levels of detection significance. The three columns show cases with Δχ2 = 100, 60, and 10 between the oblate model and the best-fit standard model with zero oblateness. Top row: noisy transit photometry (black) and the best-fitting standard model (red). Bottom row: residuals. We adopted Δχ2 ≳ 60 as the fiducial detectability threshold, and show the dependence of the yields on this threshold in Figure 5.
Other Images in This Article
Show More
Copyright and Terms & Conditions
© 2026. The Author(s). Published by the American Astronomical Society.

Copyright ©
2026 Astronomy Image Explorer. All Rights Reserved.
