

Image Details
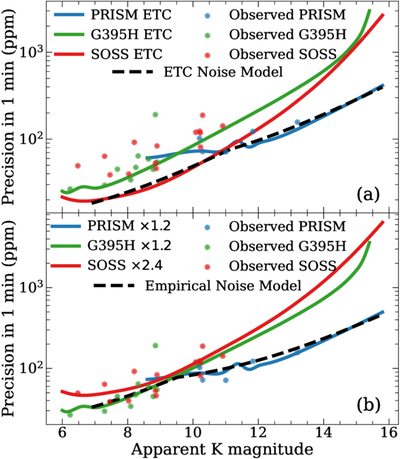
Caption: Figure 1.
JWST photometric precision per minute, based on bandpass-summed time series data and plotted vs. apparent K magnitude. (a) Empirically measured scatter reported in the literature (points), compared with ETC predictions from PandExo for three instruments/modes (curves). The dashed curve is a fitting function for the lower envelope of the ETC predictions (Equation (1)); in this fit, NIRISS/SOSS is favored for K < 11.2 and NIRSpec/PRISM at fainter magnitudes. (b) Same, but with curves fitted to empirical scatter rather than ETC predictions (Equation (2)); in this model, NIRSpec/G395H is favored for K < 9.5 and NIRSpec/PRISM at fainter magnitudes.
Other Images in This Article
Show More
Copyright and Terms & Conditions
© 2026. The Author(s). Published by the American Astronomical Society.

