

Image Details
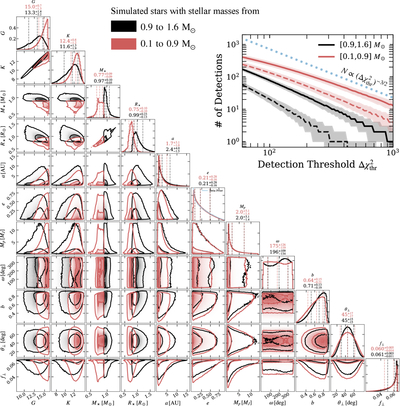
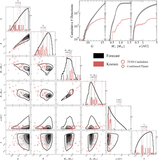
Caption: Figure 5.
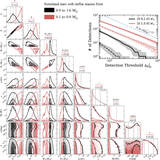
Parameter distributions of simulated systems for which Jupiter-like oblateness is detectable with Δχ2 > 60, assuming an isotropic distribution of true obliquities. Results are shown separately for stellar masses 0.9 < M⋆/M⊙ < 1.6 (black) and 0.1 < M⋆/M⊙ < 0.9 (red). Above each histogram are the median and 16th/84th percentiles. The upper-right panel shows how the number of detections scales with the Δχ2 threshold. Solid curves use the ETC noise model, dashed curves use the empirical noise model, and shaded bands indicate the 1σ range. The dotted line shows the reference scaling ﹩N\propto {({\rm{\Delta }}{\chi }_{{\rm{thr}}}^{2})}^{-3/2}﹩.
Other Images in This Article
Show More
Copyright and Terms & Conditions
© 2026. The Author(s). Published by the American Astronomical Society.

