Image Details
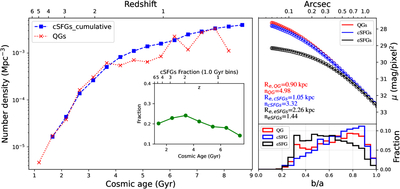
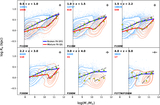
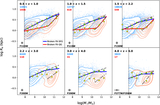
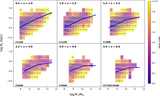
Caption: Figure 6.
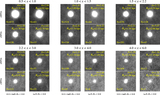
Left: evolution of the number density of cSFGs (blue dashed line with square markers) and QGs (red dotted line with cross markers) as a function of cosmic age in 0.5 Gyr bins. The cSFG curve represents the cumulative number density, obtained by summing the densities from this bin and all preceding (i.e., at younger cosmic ages) bins, while the QGs curve shows the differential number density per bin. The lower axis denotes cosmic age in Gyr, the upper axis gives the equivalent redshift, and all densities are in units of Mpc−3. The inset shows the fraction of cSFGs relative to the total SFG population as a function of cosmic time. Right top: surface brightness profiles (in mag pixel−2) as a function of radius for QGs (red), cSFGs (blue), and eSFGs (black). For each population, the data are shown as open circles. The corresponding best-fit single Sérsic model profiles are shown as solid lines, while the best-fit n and Re are shown in the bottom-left panel. All profiles are derived from stacked F200W images of galaxies at 2.2 < z < 4.0, using stellar-mass-matched samples (1010.0M⊙ < M⋆ < 1010.8M⊙; ﹩{\rm{\Delta }}\mathrm{log}{M}_{\star }\,\lt 0.1﹩ dex). The typical background level corresponds to a surface brightness of ∼34 mag pixel−2. Right bottom: the axis ratio (b/a) distribution of QGs (red), cSFGs (blue), and eSFGs (black).
Other Images in This Article
Show More
Copyright and Terms & Conditions
© 2026. The Author(s). Published by the American Astronomical Society.