Image Details
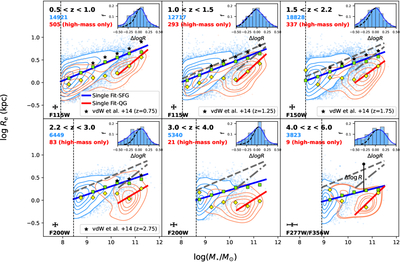
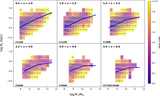
Caption: Figure 3.
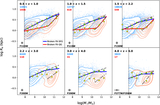
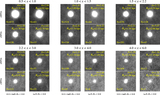
Size–mass relations fitted by a single power-law model for SFGs and high-mass QGs (M⋆ > 1010.3M⊙). Blue and red contours show the kernel density estimation (KDE)-derived density distributions of SFGs and QGs, with five levels marking the 10th, 30th, 50th, 70th, and 90th percentiles. Individual outliers are plotted as blue and red points. Green squares and yellow diamonds indicate median sizes in 0.5 dex mass bins for SFGs and QGs, respectively. Solid lines show the best-fit relations, while dashed (SFGs) and dash–dotted (QGs) reproduce the result at 0.5 < z < 1.0 for reference. The vertical dashed line marks the mass completeness limit. The bands used for size measurements are labeled in each panel. Specifically, the F277W band is adopted for 4.0 < z < 5.0 galaxies, and the F356W band is used for 5.0 < z < 6.0 galaxies. Blue and red numbers in the top left indicate the number of SFGs and QGs in each redshift bin. Black stars show the medians of SFGs from A. van der Wel et al. (2014). Insets show the histogram of the ﹩{\rm{\Delta }}\mathrm{log}R﹩ distribution for massive SFGs (M⋆ > 1010.3M⊙) with blue KDE overlaid. The black dashed curve shows a KDE mirrored from the right-hand side of the peak to the left, providing a visual reference for asymmetry. The last panel highlights an example galaxy to illustrate the definition of ﹩{\rm{\Delta }}\mathrm{log}R﹩, where ﹩{\rm{\Delta }}\mathrm{log}R﹩ is defined as the vertical offset from the best-fit single power-law relation.
Other Images in This Article
Show More
Copyright and Terms & Conditions
© 2026. The Author(s). Published by the American Astronomical Society.