Image Details
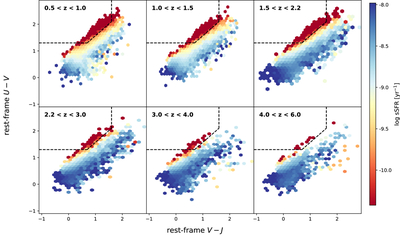
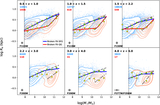
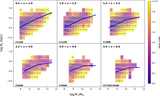
Caption: Figure 1.
Rest-frame U − V versus V − J color–color diagrams for galaxies in the redshift range 0.5 < z < 6.0, shown in six redshift bins. The distribution is shown using hexagonal binning, with each bin encoding the mean specific star formation rates (sSFR) of galaxies contributing to that bin. The black dashed lines denote the UVJ selection criterion from R. J. Williams et al. (2009) (see Appendix C).
Other Images in This Article
Show More
Copyright and Terms & Conditions
© 2026. The Author(s). Published by the American Astronomical Society.
Copyright ©
2026 Astronomy Image Explorer. All Rights Reserved.