Image Details
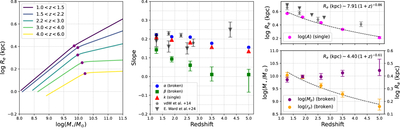
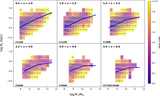
Caption: Figure 5.
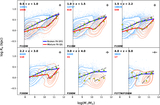
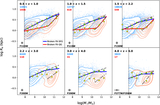
Redshift evolution of the size–mass relations and associated parameters for SFGs at 1.0 < z < 6.0. Left: evolution of the size–mass relations for SFGs. The solid lines represent the best-fit relations using a broken power-law model, with pivots indicated by purple dots. Middle: evolution of the parameters from power-law fits, including k (red triangle), α (blue dots), and β (green squares) from broken power-law fits. Right: evolution of the parameters from power-law fits in logarithmic scale. The top panel shows the intercept (magenta dots) from the single power-law model fits, while the bottom panel shows the pivot mass (purple dots) and pivot Re (orange dots) from broken power-law model fits. The best-fit single power-law parameters from A. van der Wel et al. (2014; black stars) and E. Ward et al. (2024; black inverted triangles) are also shown for comparison.
Other Images in This Article
Show More
Copyright and Terms & Conditions
© 2026. The Author(s). Published by the American Astronomical Society.