Image Details
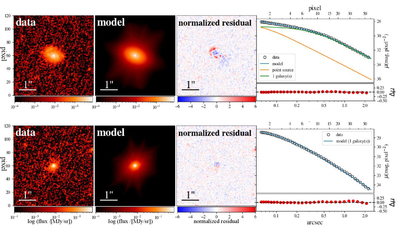
Caption: Figure 2.
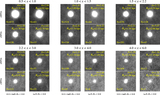
Examples of galight fitting results. In each row, the images show original data, model, normalized residuals, and 1D surface brightness profile from left to right. The upper panels show one galaxy fitted by both a single Sérsic model and a point-source model, with z = 2.2, M⋆ = 1010.5M⊙, and Re = 2.7 kpc. The lower panels show another galaxy fitted by only a single Sérsic model, with z = 3.5, M⋆ = 1010.6M⊙, and Re = 0.9 kpc.
Other Images in This Article
Show More
Copyright and Terms & Conditions
© 2026. The Author(s). Published by the American Astronomical Society.
Copyright ©
2026 Astronomy Image Explorer. All Rights Reserved.