Image Details
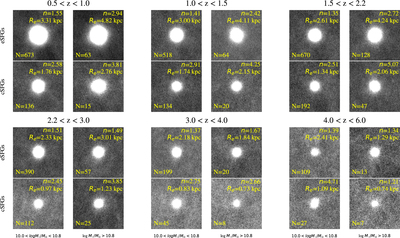
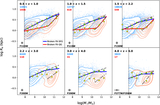
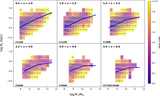
Caption: Figure E3.
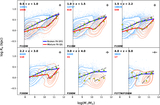
Stacked images of all eSFGs and cSFGs by median value in different stellar mass and redshift bins, using the same band as Figure 4. Sérsic index (n), effective radius (Re), and the number of galaxies (N) are marked on each subplot.
Other Images in This Article
Show More
Copyright and Terms & Conditions
© 2026. The Author(s). Published by the American Astronomical Society.
Copyright ©
2026 Astronomy Image Explorer. All Rights Reserved.