Image Details
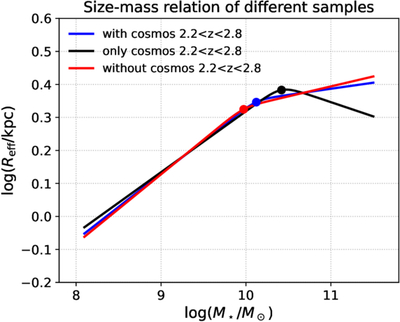
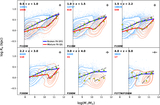
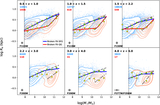
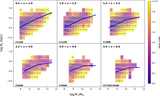
Caption: Figure D1.
Stellar size–mass relation of galaxies at 2.2 < z < 3.0. The solid curves show the best-fitting broken power-law relations obtained from three different samples: the sample including COSMOS galaxies at 2.2 < z < 2.8 (blue), the COSMOS-only subsample at 2.2 < z < 2.8 (black), and the sample excluding COSMOS galaxies in this redshift interval (red). The filled circles mark the pivot mass (﹩\mathrm{log}{M}_{{\rm{p}}}﹩) of each fit.
Other Images in This Article
Show More
Copyright and Terms & Conditions
© 2026. The Author(s). Published by the American Astronomical Society.
Copyright ©
2026 Astronomy Image Explorer. All Rights Reserved.