Image Details
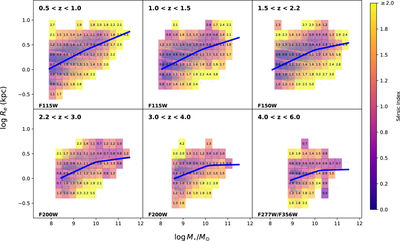
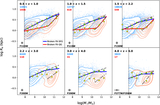
Caption: Figure E2.
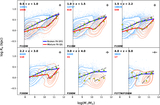
The distributions of the Sérsic index (n) for SFGs at 0.5 < z < 6.0. The numerical values overlaid on each grid cell indicate the median n within that region, and the background color also represents the median n. Blue lines show the size–mass relations fitted by a broken power-law model for SFGs.
Other Images in This Article
Show More
Copyright and Terms & Conditions
© 2026. The Author(s). Published by the American Astronomical Society.
Copyright ©
2026 Astronomy Image Explorer. All Rights Reserved.