Image Details
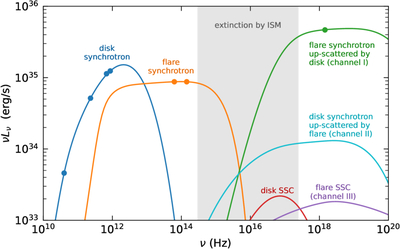
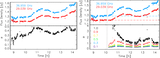
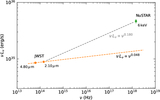
Caption: Figure 13.
Model broadband spectrum of Sgr A* during the peak of the JWST/NuSTAR flare. The blue curve shows the quasi-steady thermal synchrotron emission from the accretion flow (“disk”) with points indicating the radio/submillimeter measurements. The synchrotron emission from the NIR flare is plotted in orange with the JWST points indicated. Green, cyan, and purple show the corresponding X-ray flare emission arising from Compton upscattering via Channels I, II, and III, respectively, at vlos = 0.7c (see text); the green point indicates the NuSTAR X-ray flux at 6 keV. The gray shaded region indicates the range of frequencies (1 μm to 1 keV equivalent) that are not accessible to observation because of interstellar extinction.
Other Images in This Article
Show More
Copyright and Terms & Conditions
© 2026. The Author(s). Published by the American Astronomical Society.