Image Details
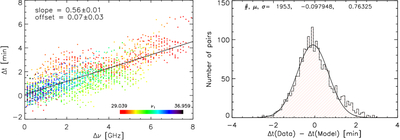
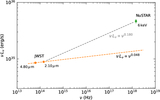
Caption: Figure 6.
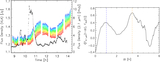
(Left) Calculated time delay between pairs of radio bands, plotted as a function of the separation between the bands. Points are color-coded according to the frequency of the low-frequency band (ν1) in each pair. A linear fit to the trend indicates a mean delay of 4.5 minutes for bands separated by 8 GHz. (Right) Histogram of the deviations of the data from the linear model in the left panel. The annotation lists the number of data points, and the mean and σ of a Gaussian fit to the histogram, indicating σ = 0.76 minutes for the model.
Other Images in This Article
Show More
Copyright and Terms & Conditions
© 2026. The Author(s). Published by the American Astronomical Society.
Copyright ©
2026 Astronomy Image Explorer. All Rights Reserved.