Image Details
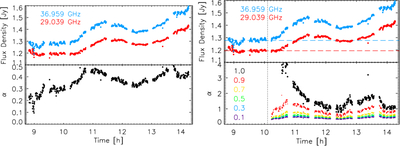
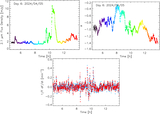
Caption: Figure 7.
(Left) The plots show the light curves at the lowest and highest radio frequencies, and the total spectral index, as a function of time (black dots) when the variable and quiescent flux densities are combined. (Right) The plots show the spectral index as a function of time, calculated after subtraction of the median flux density for times <10.1 hr UT. The time limit is indicated by the vertical line, and the subtracted flux densities are indicated in the upper subpanel. Additional spectral index results (colored dots) are also shown if the backgrounds in the top subpanel are reduced by factors ranging between 0.9 and 0.1, as listed.
Other Images in This Article
Show More
Copyright and Terms & Conditions
© 2026. The Author(s). Published by the American Astronomical Society.