Image Details
Caption: Figure 2.
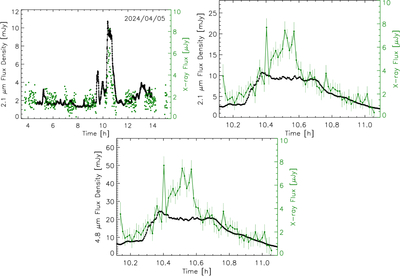
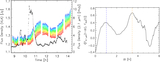
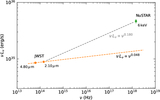
(Top left) The 2.1 μm (black) and 3–10 keV NuSTAR (green) light curves of Sgr A* show a strong X-ray flare coincident with an NIR flare. (Top right) A close-up view of the NIR light curve of the flare at 2.1 μm is shown against the X-ray light curve but is normalized such that both light curves rise together. The X-ray flare is detected within the envelope of the NIR flare. (Bottom) Similar to top right but for the light curve at 4.8 μm.
(The data used to create this figure are available in the online article.)
(The data used to create this figure are available.)
Other Images in This Article
Show More
Copyright and Terms & Conditions
© 2026. The Author(s). Published by the American Astronomical Society.
Copyright ©
2026 Astronomy Image Explorer. All Rights Reserved.