Image Details
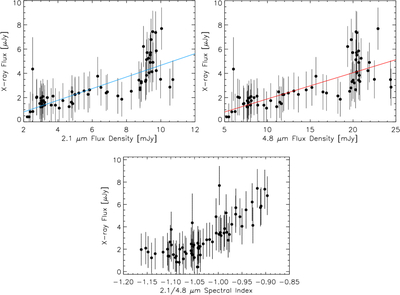
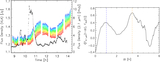
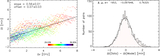
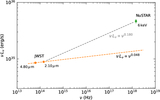
Caption: Figure 3.
(Top left) Correlation of X-ray flare emission detected by NuSTAR with NIR flare emission at 2.1 μm, illustrating their similar origin. (Top right) Similar to top left, but for emission at 4.8 μm. (Bottom) A plot of the spectral index of NIR flare emission against the X-ray flux density. A trend is noted in that the NIR spectral index becomes shallower as the X-ray flux increases. The colored line (top panels) is a linear fit to the full dataset, although the correlation seems to cease at ≳9 and ≳20 mJy in the IR fluxes.
Other Images in This Article
Show More
Copyright and Terms & Conditions
© 2026. The Author(s). Published by the American Astronomical Society.
Copyright ©
2026 Astronomy Image Explorer. All Rights Reserved.