Image Details
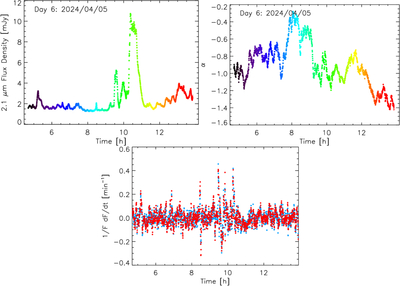
Caption: Figure 4.
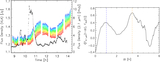
(Top left) Light curve of Sgr A* at 2.1 μm taken on 2024 April 5. (Top right) Same as top left, except using the NIR spectral index of Sgr A* as a function of time. (Bottom) Same as top left, except that normalized values of the time derivative of the flux at 2.1 (blue) and 4.8 μm (red) are displayed as a function of time.
Other Images in This Article
Show More
Copyright and Terms & Conditions
© 2026. The Author(s). Published by the American Astronomical Society.
Copyright ©
2026 Astronomy Image Explorer. All Rights Reserved.