Image Details
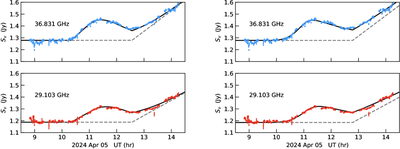
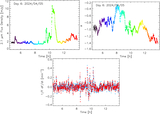
Caption: Figure 8.
Best-fit adiabatically expanding synchrotron source models for the radio light curves on 2024 April 5, assuming (left) a relativistic Maxwellian distribution of electron energies or (right) a power-law energy spectrum. The observed light curves at 36.8 and 29.1 GHz are plotted in blue and red, respectively. Gray dashed lines indicate the underlying slow variation of the quiescent flux, and solid curves include the addition of a flaring component contributed by an expanding synchrotron source which peaks as it transitions from being optically thick to thin (see text).
Other Images in This Article
Show More
Copyright and Terms & Conditions
© 2026. The Author(s). Published by the American Astronomical Society.
Copyright ©
2026 Astronomy Image Explorer. All Rights Reserved.