Image Details
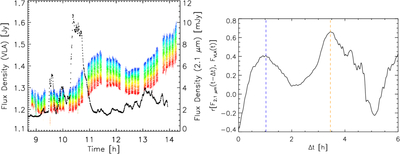
Caption: Figure 5.
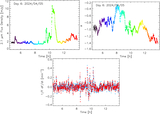
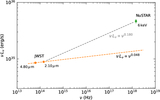
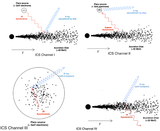
(Left) Superimposed on the NIR light curve at 2.1 μm are the light curves of Sgr A* at 1 cm, ranging from frequencies 29 GHz to 37 GHz with colors from red to blue to violet. Note that the scale for the radio flux density does not start at zero (i.e., the contrast in the variation of the radio emission is much lower than in the NIR). (Right) The cross correlation coefficient between NIR and radio as a function of lag time. There are two peaks shown with dashed lines at the 1 and 3.5 hr lag times.
(The data used to create this figure are available in the online article.)
(The data used to create this figure are available.)
Other Images in This Article
Show More
Copyright and Terms & Conditions
© 2026. The Author(s). Published by the American Astronomical Society.