Image Details
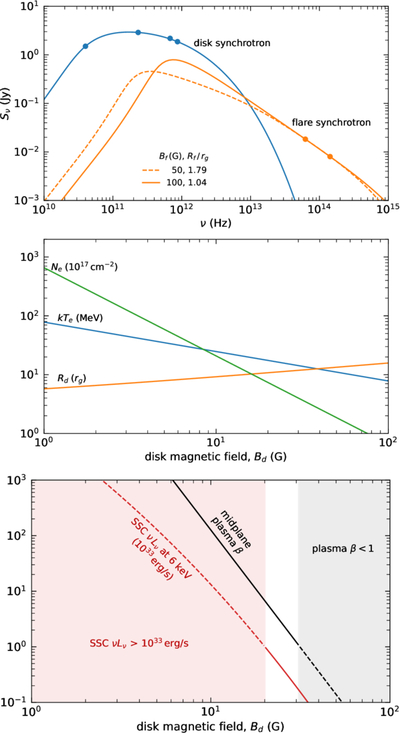
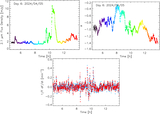
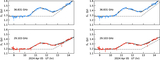
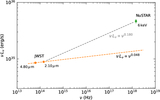
Caption: Figure 11.
(Top) The blue curve shows the synchrotron flux density of a homogeneous thermal disk, fit to the observed fluxes at four frequencies from radio to submillimeter (solid points). The orange curves show the synchrotron emission from uniform sphere models for the flaring source region, for different assumed fields and different radii. The power-law electron population has been chosen to match the JWST measurements at 2.1 and 4.8 μm with Sν ∝ ν−1 in the optically thin part of the spectrum. (Middle) Disk parameters that produce the blue synchrotron spectrum shown in the top panel as a function of disk field strength, Bd: radius in gravitational radii rg (orange), electron temperature (blue), and electron column density (green). (Bottom) Constraints on the magnetic field of the disk models presented in the upper panels. First, the SSC X-ray luminosity (red curve) must be less than ∼1033 erg s−1 to be consistent with Chandra limits on quasi-steady X-ray emission from Sgr A*, ruling out the region Bd ≤ 20 G (pink shading). Second, the gas pressure at the midplane should dominate magnetic pressure, i.e., the plasma beta (black curve) should be greater than 1, eliminating the region Bd ≥ 30 G (gray shading). We conclude that Bd should lie in the range 20–30 G (see text).
Other Images in This Article
Show More
Copyright and Terms & Conditions
© 2026. The Author(s). Published by the American Astronomical Society.