

Image Details
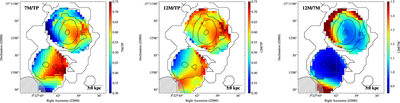
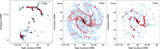
Caption: Figure 7.
CO(J = 1−0) integrated intensity ratio maps derived from 12 m, 7 m, and TP array moment 0 data. From left to right, panels show the 7 m/TP, 12 m/TP, and 12 m/7 m ratios. The black contour represents the integrated intensity map from the TP data. The gray hatched circle in the lower left corner indicates the beam size.
Other Images in This Article
Show More
Copyright and Terms & Conditions
© 2026. The Author(s). Published by the American Astronomical Society.

Copyright ©
2026 Astronomy Image Explorer. All Rights Reserved.
