

Image Details
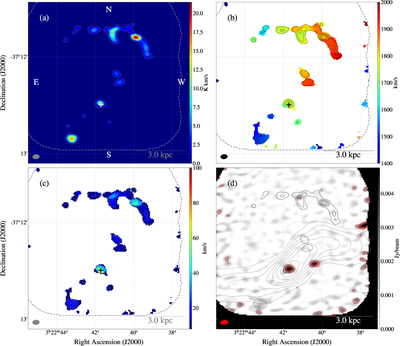
Caption: Figure 5.
Same as Figure 2 but for the CO(J = 3−2) emission and the 330 GHz continuum. All panels and overlying contours correspond to the CO(J = 3−2) transition. The gray dashed lines in panels (a)–(c) indicate the FoV of the ALMA observations.
Other Images in This Article
Show More
Copyright and Terms & Conditions
© 2026. The Author(s). Published by the American Astronomical Society.

Copyright ©
2026 Astronomy Image Explorer. All Rights Reserved.
