

Image Details
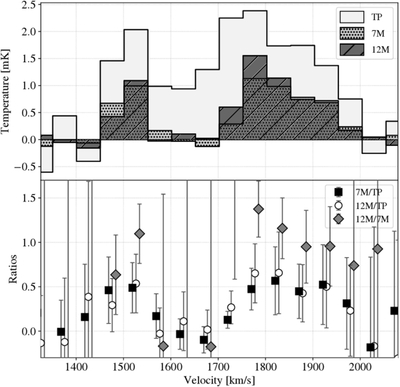
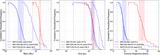
Caption: Figure 6.
Top panel: comparison of the CO(J = 1−0) spectra integrated over the entire galaxy obtained with the TP, 7 m, and 12 m arrays, smoothed to a velocity resolution of 50 km s−1. The flux was integrated over a 150″ × 160″ rectangular region centered at ﹩(\alpha ,\delta )=(0{3}^{{\rm{h}}\,}2{2}^{{\rm{m}}}41.30{0}^{\,{\rm{s}}},-37^\circ 1{2}^{{\prime} }15.98{5}^{{\prime\prime} })﹩, covering the full extent of the galactic emission. The spectra are distinguished by their hatching patterns: TP (no hatching), 7 m/TP (filled black squares), 12 m/TP (open circles), and 12 m/7 m (filled gray diamonds). Error bars were derived from the rms noise of each individual spectrum. The data points for each ratio are slightly shifted along the velocity axis (by 7.5 km s−1, or 15% of the velocity resolution) to avoid overlapping of the error bars. The 7 and 12 m intensities are negligible in the velocity range of 1550−1700 km s−1. Even in other channels where emission is detected, the intensities detected by the 7 and 12 m arrays remain less than half of the TP intensity.
Other Images in This Article
Show More
Copyright and Terms & Conditions
© 2026. The Author(s). Published by the American Astronomical Society.

