

Image Details
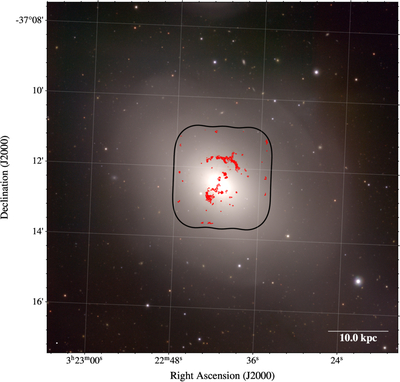
Caption: Figure 1.
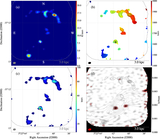
Three-color composite image of NGC 1316 from the Fornax Deep Survey (E. Iodice et al. 2016, 2017) using g-, r-, and i-band data obtained with the ESO VLT Survey Telescope. The ALMA observations were conducted to resolve the molecular gas properties within the central region of the galaxy. Red contours represent the CO(J = 1−0) emission map obtained with our ALMA observations. The solid black line indicates the FoV of the ALMA CO(J = 1−0) observations.
Other Images in This Article
Show More
Copyright and Terms & Conditions
© 2026. The Author(s). Published by the American Astronomical Society.

Copyright ©
2026 Astronomy Image Explorer. All Rights Reserved.
