

Image Details
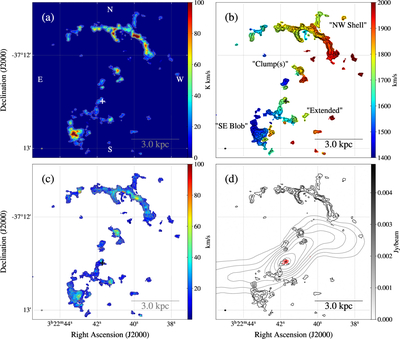
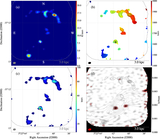
Caption: Figure 2.
CO(J = 1−0) and 100 GHz continuum maps of NGC 1316. (a) Integrated intensity map in units of K km s−1. (b) Intensity-weighted mean velocity map (moment 1) in km s−1. (c) Velocity dispersion map (moment 2) in km s−1. (d) 100 GHz continuum map in Jy beam−1. In all panels, the CO(J = 1−0) integrated intensity is shown as contours, with gray contours in (a), black contours in (b), gray contours in (c), and black contours in (d). In panel (d), the red and gray contours represent the 100 GHz continuum from ALMA and the 1.4 GHz continuum from MeerKAT, respectively. Note that the beam size for the MeerKAT 1.4 GHz continuum is 6﹩\mathop{.}\limits^{{\unicode{x02033}}}﹩8 × 5﹩\mathop{.}\limits^{{\unicode{x02033}}}﹩8 with a position angle of −62﹩\mathop{.}\limits^{{\unicode{x000b0}}}﹩5. The galactic center is indicated by a cross. The synthesized beam is indicated in the bottom left corner of each panel. North is up, and east is to the left.
Other Images in This Article
Show More
Copyright and Terms & Conditions
© 2026. The Author(s). Published by the American Astronomical Society.

