

Image Details
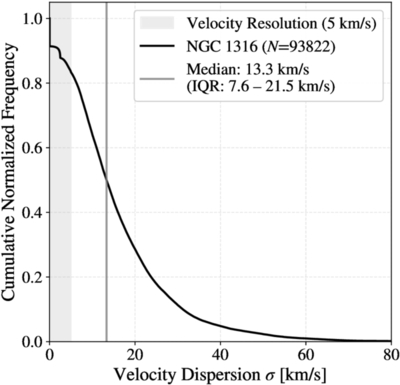
Caption: Figure 3.
Cumulative frequency distribution of the velocity dispersion data shown in Figure 2. The median value (13.3 km s−1) is indicated by the solid gray line. The velocity resolution of the data is 5 km s−1, represented by the gray shaded region. While the majority of the distribution lies below 20 km s−1, there are some regions with dispersions exceeding 50 km s−1.
Other Images in This Article
Show More
Copyright and Terms & Conditions
© 2026. The Author(s). Published by the American Astronomical Society.

Copyright ©
2026 Astronomy Image Explorer. All Rights Reserved.
