

Image Details
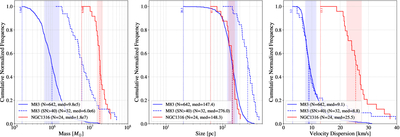
Caption: Figure 9.
Comparison of GMA properties between NGC 1316 (red) and M83 (blue). From left to right, the panels show the distributions of GMA mass, size (parsecs), and velocity dispersion (km s−1). Solid and dashed lines represent the results using S/N > 4 and S/N > 40 thresholds for cloud identification, respectively. For each distribution, the vertical dashed lines indicate the median values, while the surrounding semitransparent shaded regions represent the IQR. The vertical dotted lines indicate the minimum mass, size, and velocity dispersion values for the GMAs identified in each galaxy.
Other Images in This Article
Show More
Copyright and Terms & Conditions
© 2026. The Author(s). Published by the American Astronomical Society.

Copyright ©
2026 Astronomy Image Explorer. All Rights Reserved.
