

Image Details
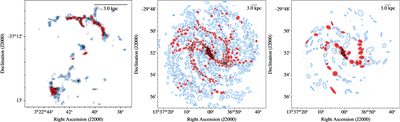
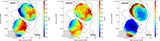
Caption: Figure 8.
Spatial distribution of GMAs identified by PYCPROPS in NGC 1316 (left), M83 (middle), and a version of M83 simulated to match the sensitivity of the NGC 1316 data (right). Red markers denote GMAs with S/N ≥ 6. In NGC 1316, GMAs are predominantly concentrated in the NW Shell and the SE Blob, whereas in M83, they are primarily distributed along the spiral arms. Because the original M83 data have an S/N 10 times higher than that of NGC 1316, the emission detection threshold used in SoFiA to generate the input mask for the GMA search was made 10 times more stringent for M83. It is evident from this comparison that this adjustment results in the identification of larger GMA sizes.
Other Images in This Article
Show More
Copyright and Terms & Conditions
© 2026. The Author(s). Published by the American Astronomical Society.

