

Image Details
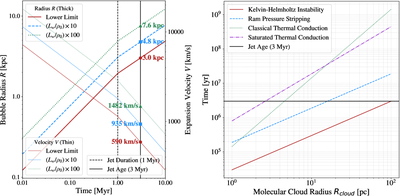
Caption: Figure 18.
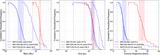
(Left) Evolution of bubble radius R(t) (left axis) and expansion velocity V(t) (right axis) based on Equation (2). The red solid, blue dashed, and green dotted lines represent the lower limit (Lw = 1.6 × 1043 erg s−1, ne = 0.01 cm−3) and cases where Lw/ρ0 is increased by factors of 10 and 100, respectively. Symbols indicate the expected values at a jet age of 3 Myr, as denoted by the vertical line. (Right) Destruction timescales of molecular clouds as a function of cloud radius. The red solid and blue dashed lines represent the timescales for KH instability (tKHI) and cloud ablation (tabl), respectively. The green dotted and purple dotted–dashed lines correspond to classical and saturated thermal conduction timescales. The horizontal black line indicates the jet age of 3 Myr. The intersection of this reference line with each timescale defines the maximum cloud size that can be fully disrupted within the jet’s lifetime.
Other Images in This Article
Show More
Copyright and Terms & Conditions
© 2026. The Author(s). Published by the American Astronomical Society.

