

Image Details
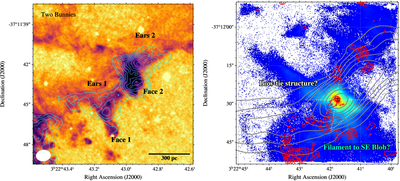
Caption: Figure 17.
(Left) Example of the bunny-face structures observed in the east side of the NW Shell. The map shows the HST dust extinction (background) overlaid with CO(J = 1−0) emission contours. Two distinct “bunny” shapes are visible, with the CO emission peaks corresponding to the “face” of each structure. The white circle in the lower left corner indicates the synthesized beam of the CO observations. (Right) The [N II] λ6583 emission map, with intensity levels adjusted to highlight bright central structures, overlaid with ALMA CO(J = 1–0) (red contours) and MeerKAT 1.4 GHz continuum (gray contours). The central emission exhibits a characteristic bow-tie shape.
Other Images in This Article
Show More
Copyright and Terms & Conditions
© 2026. The Author(s). Published by the American Astronomical Society.

