

Image Details
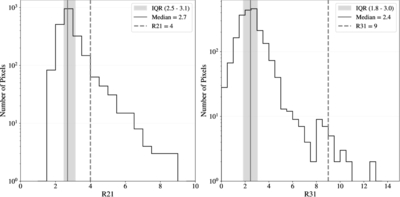
Caption: Figure 12.
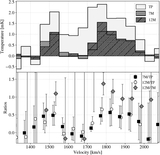
Histograms of R21 and R31 derived from the ratio maps shown in Figure 11. The ratios are calculated using flux units of Jy beam−1, with the vertical axis presented on a log scale. The median value for each distribution is indicated by a solid gray line, while the IQR (first to third quartiles) is highlighted by the translucent gray shaded area. The gray dashed lines represent a ratio of unity (R = 1) in kelvin units. While the ratios are generally comparable to those observed in typical star-forming galaxies, certain regions exhibit R21 and R31 values exceeding unity in kelvin units.
Other Images in This Article
Show More
Copyright and Terms & Conditions
© 2026. The Author(s). Published by the American Astronomical Society.

Copyright ©
2026 Astronomy Image Explorer. All Rights Reserved.
