

Image Details
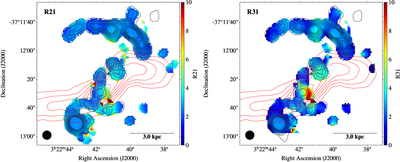
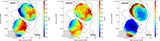
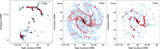
Caption: Figure 11.
R21 and R31 maps using the peak intensity maps of each line in Jy units. The black contours indicate the CO(J = 2−1) integrated intensity map, and the red contours outline the S-shaped nuclear jet. Elevated ratios are observed at several locations along the jet; in particular, the region to the west of the galactic center exhibits relatively high values, with R21 ∼ 4 and R31 ∼ 9.
Other Images in This Article
Show More
Copyright and Terms & Conditions
© 2026. The Author(s). Published by the American Astronomical Society.

Copyright ©
2026 Astronomy Image Explorer. All Rights Reserved.
