Image Details
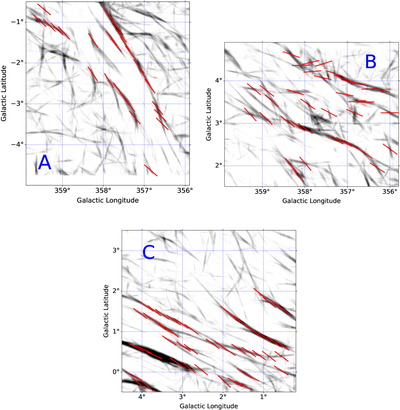
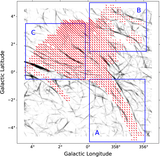
Caption: Figure 9.
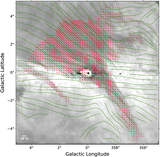
Zoomed-in views of three representative subregions (corresponding to Fields A, B, and C in Figure 8) showing H I self-absorption filaments extracted with the RHT analysis (in grayscale) overlaid with plane-of-sky magnetic-field orientations derived from stellar polarization (red segments) and positioned along the filaments using spatial sampling without a fixed grid. The filamentary structures closely follow the polarization segments that trace the projected magnetic-field orientation.
Other Images in This Article
Show More
Copyright and Terms & Conditions
© 2026. The Author(s). Published by the American Astronomical Society.
Copyright ©
2026 Astronomy Image Explorer. All Rights Reserved.