Image Details
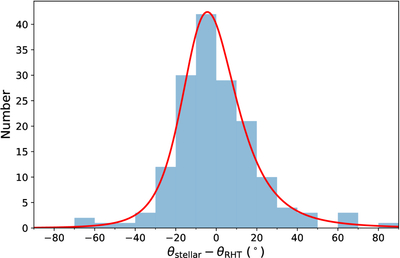
Caption: Figure 10.
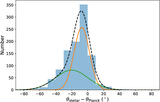
Distribution of the angular differences Δθ = θstellar − θRHT. The histogram shows the observed frequency of angle offsets between the stellar polarization and the RHT-derived orientations. The red solid line represents the best-fitting skew-t distribution, which provides an excellent description of the asymmetric shape and extended tails of the data. The distribution is strongly peaked near zero, indicating a high degree of alignment between the two tracers, with a slight skewness reflecting residual systematic deviations.
Other Images in This Article
Show More
Copyright and Terms & Conditions
© 2026. The Author(s). Published by the American Astronomical Society.
Copyright ©
2026 Astronomy Image Explorer. All Rights Reserved.